
Business
How Hyderabad man duped 7,400 investors
By Katherine Langford
Advertisement · Why this ad?
Katherine oversees editorial operations across all six brands. Before joining The Meridan Group, she spent 14 years at the Minneapolis Star Tribune, where she led the metro desk through its digital transformation. She holds a Master's in Journalism from Northwestern's Medill School.
More from Katherine →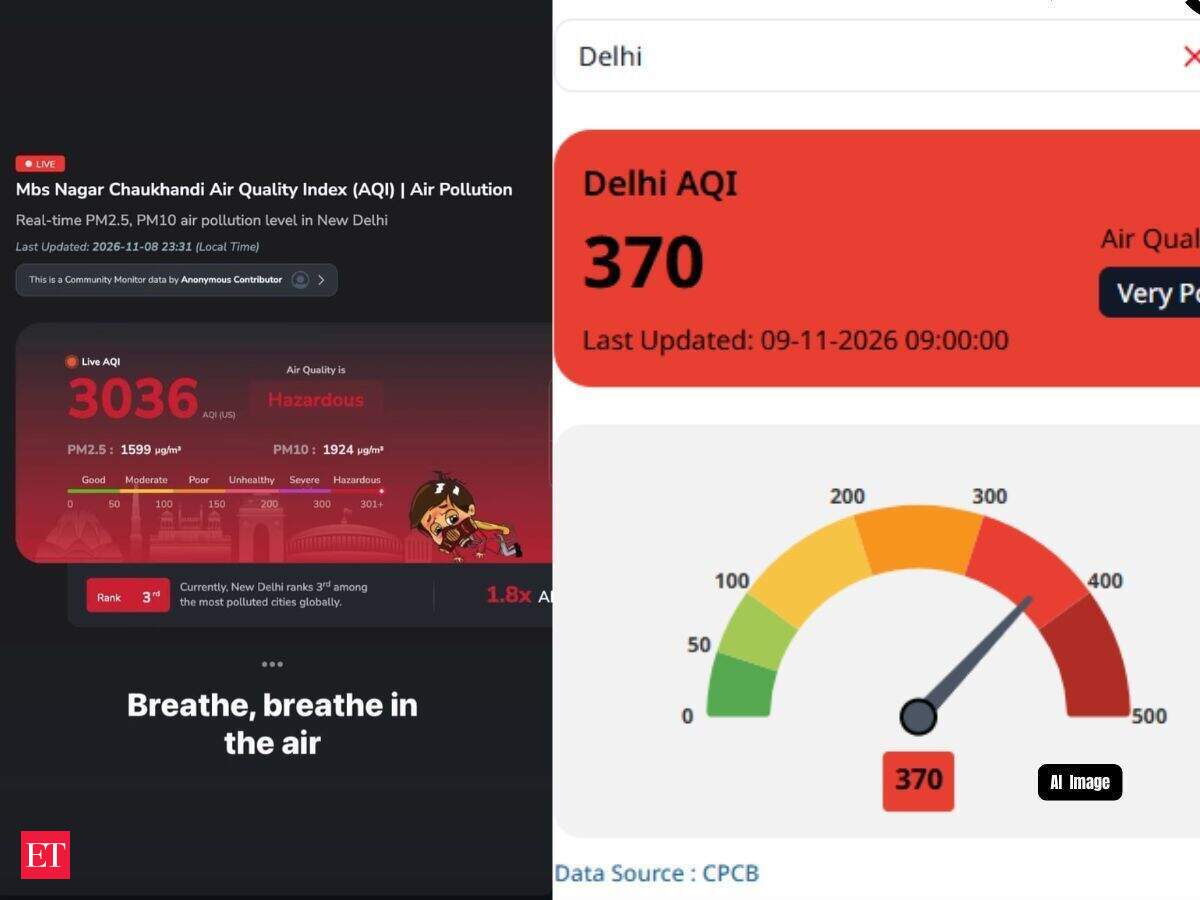
Delhi's air pollution has become a subject of confusion for those checking air quality on their phones. While government monitoring platforms have reported an AQI in the 300s, some independent air quality websites have displayed numbers touching 1,000, 1,600 and even above 3,000. The difference has left many people wondering whether Delhi's AQI is 300 or 3,000. Is one of the platforms reporting incorrect information, or are they measuring pollution differently? The answer lies in how air quality is calculated. India's Central Pollution Control Board (CPCB) follows the National Air Quality Index (AQI), while several international platforms, including IQAir, use the US AQI system. Both systems convert pollutant concentrations into numerical scores, but their formulas, measurement periods and data sources differ. This means the same air can produce dramatically different AQI numbers on different platforms. However, a lower official number does not necessarily mean the air is safe to breathe. AAP questions credibility of Delhi's AQI data The debate over Delhi's pollution figures took a political turn on Monday after AAP Delhi president Saurabh Bharadwaj accused the government of manipulating official air quality readings. Bharadwaj alleged that several pollution monitoring stations had been shut down, while around 20 new AQI stations were established at locations far away from pollution hotspots. He also claimed that water was being sprinkled near monitoring stations to influence the readings. Speaking to news agency ANI, the AAP leader said people had lost confidence in the government's pollution data. He questioned the reliability of official AQI figures and alleged that the monitoring process was not reflecting the actual pollution situation in the capital. Bharadwaj also warned that presenting misleading pollution figures could put people's health at risk. Referring to Diwali firecracker celebrations, he said those responsible for bursting crackers should also accept responsibility for the resulting pollution. Delhi AQI today: Why are government and private apps showing different numbers? The difference became particularly noticeable after Diwali in November 2026, when residents began comparing readings across multiple platforms. On November 9, the CPCB's Sameer application showed Delhi's average AQI at 368 at around 7 am, placing the city in the Very Poor category. Several individual monitoring stations, however, recorded readings above 400. Live Events You Might Also Like: Delhi AQI today: Air pollution readings turns severe after Diwali bursts: Check area-wise levels here Meanwhile, private monitoring platforms reported much higher figures. A private air pollution monitoring platform showed Delhi's average AQI at 895 around 7:30 am. Some locations, including Safdarjung Development Area, were reporting readings above 1,600 on AQI.in. The numbers looked dramatically different, even though the platforms were reporting pollution in the same city. 1. India's AQI scale stops at 500, but US AQI can go higher One of the biggest reasons behind the difference is the AQI calculation system. India follows its National Air Quality Index, which categorises air quality into six levels. The scale runs from 0 to 500, with anything above 400 falling in the Severe category. International platforms such as IQAir use the US Environmental Protection Agency's AQI methodology. Although this system also has a 0–500 scale, it allows readings to go beyond 500 when pollution concentrations become extremely high. This is why some international platforms can display readings of 1,000, 1,500 or even 2,000, while the Indian government dashboard will not show a corresponding AQI above 500. In simple terms, India's AQI system places extremely polluted air in its highest category, while the US system can continue assigning higher numerical values. You Might Also Like: AQI: Delhi at 743, Lucknow at 493, Indore at 449 after Diwali; check AQI across major Indian cities 2. CPCB and IQAir use different calculation methods The two systems also differ in how they convert pollutant concentrations into AQI numbers. India's National AQI considers eight pollutants: PM2.5, PM10, nitrogen dioxide, sulphur dioxide, carbon monoxide, ozone, ammonia and lead. Each pollutant receives a separate sub-index based on its concentration. The highest sub-index determines the monitoring station's overall AQI, provided the minimum data requirements are met. IQAir, meanwhile, uses the US AQI methodology and its own data processing approach. Consequently, the same concentration of PM2.5 can produce different AQI scores under the two systems. A reading of 300 on India's scale cannot be directly compared with 300 on the US scale. This is an important distinction when people share screenshots of different pollution apps on social media. 3. One app may show hourly pollution, another may use longer averages The time period used to calculate air quality also matters. India's National AQI methodology uses different averaging periods for different pollutants. PM2.5 and PM10 concentrations generally use 24-hour averages, while carbon monoxide and ozone use eight-hour averages. IQAir's real-time AQI+ readings are more responsive to hourly changes in pollution. This can make a significant difference during periods when air quality deteriorates rapidly, such as Diwali night. Firecracker emissions can cause a sudden rise in particulate matter. An hourly reading may reflect that spike quickly, while a longer averaging period may show a comparatively lower number. It works the other way around, too. If wind speeds improve and pollution begins dispersing, hourly readings can fall faster than figures based on longer averaging periods. 4. Different monitoring stations can produce different results Another reason is the location of monitoring stations. CPCB and DPCC operate government monitoring stations across Delhi. Private platforms may combine readings from government stations, independent sensors and other contributors. Even within Delhi, pollution levels are not uniform. A monitoring station near a busy traffic junction, industrial area or construction site may record much higher pollution than one in a relatively green residential neighbourhood. The way platforms combine these readings also matters. The Delhi government's AQI portal calculates the citywide figure by averaging AQI readings from stations reporting during that hour. IQAir's citywide AQI+ uses a different aggregation approach. Therefore, a local hotspot reading should not be confused with the average pollution level across the entire national capital. 5. Government monitors and private sensors may not give identical readings The equipment used to measure pollution is another factor. Government monitoring stations generally use reference-grade analysers that follow established measurement and calibration procedures. Independent platforms may also use lower-cost air quality sensors. These devices help expand monitoring coverage, but their readings can vary depending on calibration, maintenance and environmental conditions. Humidity, in particular, can affect measurements from some low-cost particulate matter sensors. This does not mean every private reading is inaccurate. It means users should check the monitoring source and measurement method before treating two numbers as directly comparable. Why PM2.5 concentration may be more useful than AQI numbers For people trying to understand how polluted Delhi's air actually is, looking at PM2.5 concentration can provide additional clarity. PM2.5 refers to fine particulate matter measuring 2.5 micrometres or less. These particles are small enough to penetrate deep into the lungs and can enter the bloodstream. Unlike AQI scores, which depend on the calculation system being used, PM2.5 concentration is expressed in micrograms per cubic metre (µg/m³). For instance, India's 24-hour permi